From Messy Data to Publication: A PhD Story

From Messy Data to Publication: A PhD Story
How did a pharmacogenetics study evolve through six stages, three code rewrites, and one critical indexing error? This blog post provides a short story behind the scenes of my final PhD project.
July 20, 2025
The path from the spark of an idea to a published paper rarely follows the linear narrative presented in published papers, at least not in my experience. More often than not, research follows a maze of trials and errors: trying one direction, going back, exploring a side path that turns out to be more promising than initially thought and eventually becomes the main path, and encountering many dead ends along the way.
Here I describe how the research project on pharmacogenetics using electronic health records in biobanks came together. This was the final project of my PhD, a research project that was very close to my heart since my PhD was originally supposed to focus primarily on this topic.
This research project was far from being completed in a logical order. Many factors played a role: messy data, unclear hypotheses and scope, little guidance in the literature on best practices for analyzing electronic health records in biobanks, limited knowledge of healthcare-specific prescription patterns, and-perhaps most surprisingly—a coding mistake discovered during peer review. If you have ever taken a computational programming class, you may remember that different programming languages use different indexing systems: some are 0-based (like Python) and others 1-based (like R), meaning that index 1 retrieves the first element in R but the second element in Python. I tend to switch between Python and R depending on the use case, and learned the hard way that mixing and matching languages in your mind can produce unexpected side effects.
Table of Contents
The Research Question
Biobanks like the UK Biobank and the All of Us Research Program contain rich longitudinal data on medication prescriptions and clinical measurements. We wanted to explore whether these resources could be used to identify genetic predictors of drug efficacy, a relatively unexplored application at the time.
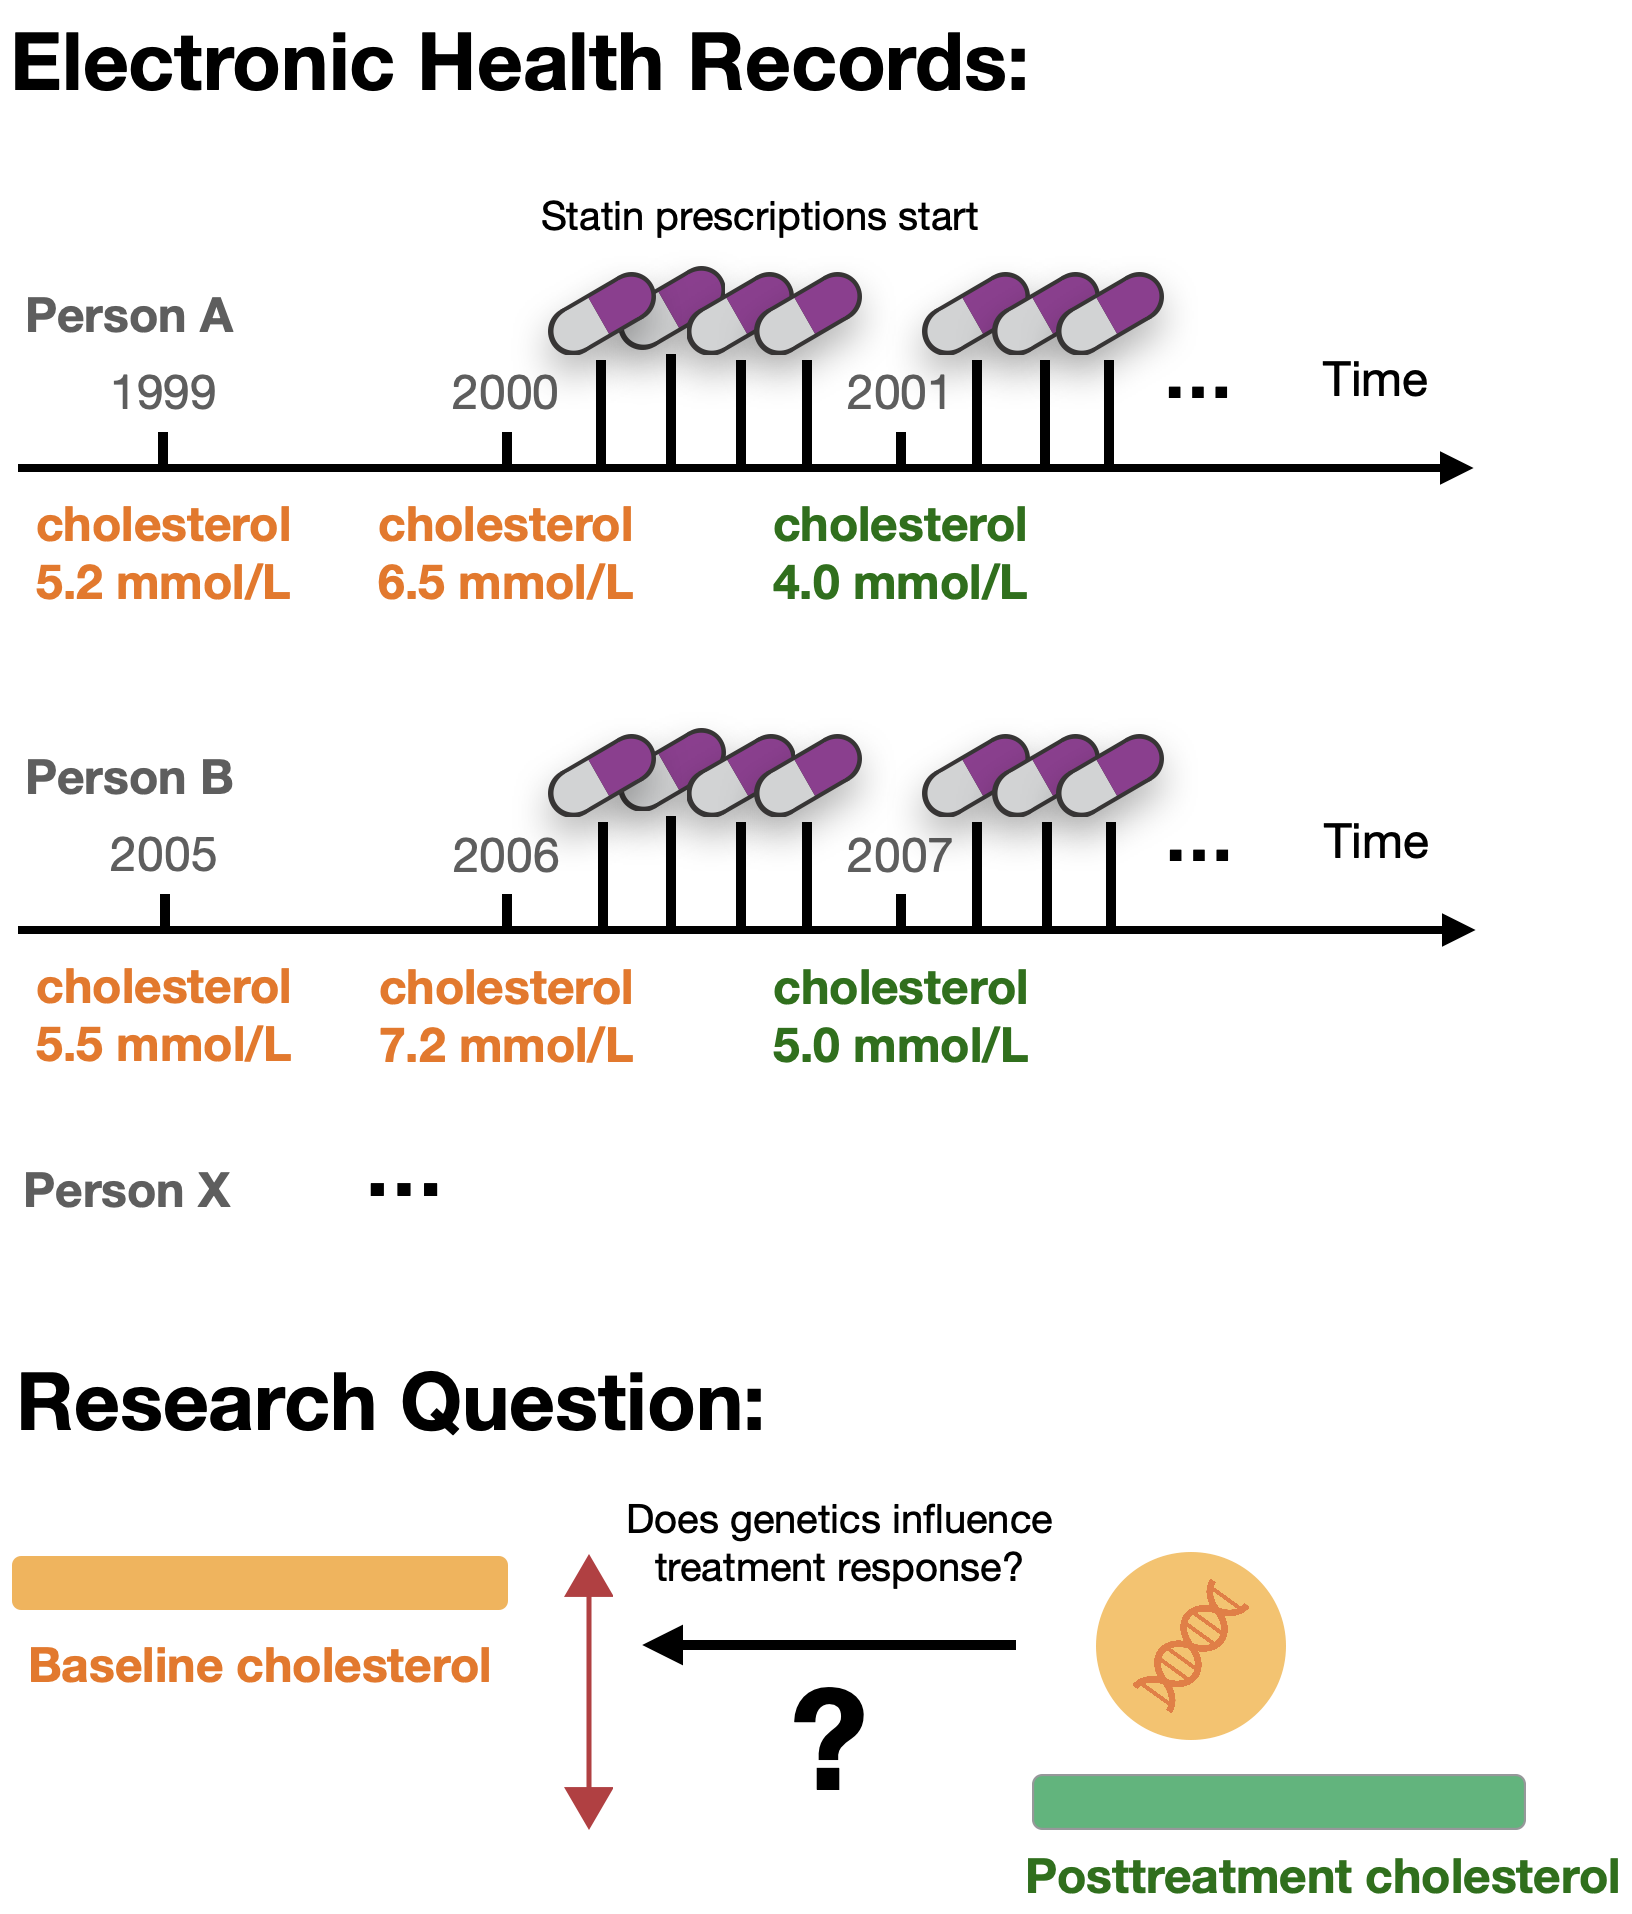
Previous pharmacogenetic studies in biobanks had focused on known pharmacogenes and their associations with adverse drug reactions, drug dosage, or prescribing behavior. Others analyzed the genetics of medication use patterns independently of disease outcomes. However, analyzing medication trajectories to extract biomarker levels before and after treatment start was relatively novel, and we weren’t sure the data would support such analyses (learn more about pharmacogenetics in this blog post).
Click to view a scheme of medication and biomarker trajectories.
The Journey: Six Stages of Discovery
Stage 1: Playing with the Data
I started by using the All of Us biobank back in 2022, when the database was very new. At the time, I was a visiting researcher at Stanford University in Prof. Russ Altman’s group. Being in the US gave me access to the database, which wasn’t yet available outside the country.
There were still issues with the platform, the biobank was organized differently from the UK Biobank I was used to working with, in addition to me being unfamiliar with working in a cloud environment, so progress was slower than expected. But by working through the tutorials and slowly getting familiar with the database structure, I managed to run some basic pharmacogenetic analyses. First, I looked only at the genetics, deriving star allele haplotypes and metabolizer phenotypes. Then I integrated phenotypic information like biomarker measurements and medication prescriptions.
These initial database explorations quickly taught me the challenges of analyzing electronic health records: irregular prescriptions, missing data, and messy timestamps - important realizations that influenced the design of the more systematic UK Biobank analysis later on.
The "WOW" moment
Stage 2: Learning from Previous Work
As the research group of Prof. Altman had previously published work on pharmacogenetics in the UK Biobank involving medication trajectory analysis, I reached out to a former PhD student who led those analyses. Doing so, provided me with useful information on the completeness and reliability of medication prescriptions in the UK Biobank, plus code to extract dose information from medication labels. This was a valuable anchor point that prompted me to switch from All of Us to the UK Biobank and run a systematic analysis on the genetics determining LDL cholesterol response following statin prescriptions.
Indeed, prescription data in the UK Biobank followed much more regular patterns than what I had observed in All of Us, and early tests showed that genetic signals known for statins replicated better. The idea that you could derive clean drug response phenotypes in biobanks with large sample sizes, potentially matching or even outperforming those used in previous publications, slowly took shape.
Stage 3: Facing Reality
As I conducted the analyses, several challenges became clear. The data was messier than anticipated, raising fundamental questions about the study design:
-
Medication switches
People frequently changed statin types and doses, making it unclear which drug at what dosage was responsible for biomarker changes. This issue was particularly pronounced for antihypertensives. -
Irregular prescriptions
Large gaps between prescriptions raised questions about adherence and whether patients were actually taking medications. -
Missing biomarker measurements
Not everyone had measurements within a few months or weeks before and after treatment start, requiring trade-offs between sample size and data quality. Lack of biomarker measurements at the right timing was the main reason an individual with medication prescriptions of the right type was excluded from the analysis.
A clear trade-off emerged between data quality and quantity: removing individuals with irregular prescriptions would decrease sample size, while keeping them risked introducing noise into the results.
My knowledge of the UK healthcare system and cardiometabolic medications was also limited, raising additional questions: How reliable are the recordings in the UK Biobank? Should there be a minimum baseline level threshold? How careful do we need to be about co-medications?
Reaching out to experts in the field helped resolve some of these issues. Based on the data distributions we observed, we made guided decisions on filtering strategies, introducing both stringent and lenient filtering approaches to address the quality-versus-quantity problem. With these decisions made, I wrote the first version of the analysis pipeline to run the analysis from start to finish.
Stage 4: Expanding the Scope
As we tried different strategies and better understood how the parameters affected the results, we revisited the research project and came up with a study design that would comprehensively tell the story of pharmacogenetics for cardiometabolic medications in biobanks.
I rewrote the pipeline a second time to integrate more parameters, medications, and biomarkers. We added polygenic risk score analyses, analyzed whole exome data in addition to the imputed genotype data, and I supervised a student who conducted replication analyses in the All of Us biobank.
Stage 5: The First “Final” Version
As all the pieces came together, we wrote the manuscript, generated the main figures, and created supplementary tables and figures. Following the internal review process, all the material was ready to be submitted.
Prior to finalization, I rewrote and reran the pipeline a third time. In the meantime, it had become quite complex and was easy to lose track of, as up-to-date code was mixed with legacy code. This resulted in a cleaner version that was easier to use and could be shared more comfortably with peers.
Stage 6: When Reviewers Ask the Right Questions
Eventually, the peer review comments came back. Overall, they were constructive, and the reviewers seemed genuinely appreciative of the work which felt rewarding. Importantly, they flagged parts that could benefit from further explanation and additional analyses, particularly around the filtering strategies. Why, for example, were post-treatment measures only taken after six months of medication start?
As I conducted these sensitivity analyses, I discovered something troubling: I had made an early mistake when assessing the distribution of biomarker measures.
All analyses had to be rerun. But peer review significantly improved the manuscript: important sensitivity analyses were added, and the results aligned better with what previous pharmacogenetic studies had found.
All this while having already finished my PhD and working full-time in industry, a challenging juggle that felt exhausting.
What I Learned: Embracing the Mess
“Let the data speak” sounds like good advice in data-rich environments, but in practice, letting the data speak is an iterative process. You need to look at the data first to understand what questions you can ask, then formulate hypotheses, and then go back to test them. This cycle often repeats multiple times.
In a project with so many unknowns, it’s unlikely you’ll get things right the first time. Multiple iterations and trial and error are necessary to fully understand the data and its limitations.
Practical lessons for computational research
Three pipeline rewrites improved both code quality and scientific rigor. It felt frustrating at the time, especially knowing there was still room for improvement, but each version was better than the last.
2. Workflow managers are game changers
I used Snakemake, which made rerunning analyses manageable and avoided a reproducibility crisis. It significantly decreased the time needed to rerun the pipeline with different parameters.
3. Expert input is invaluable
Healthcare and UK Biobank specialists helped navigate domain-specific challenges. Don't be shy about reaching out!
4. Peer review improves science
Reviewer questions led to both clearer explanations and actual improvements in results.